Who can use this feature?
Understanding how users are using and adopting your application is obviously a critical piece of information that can help your organization understand where to invest resources on onboarding, training, and documentation.
For example, if a part of the product is infrequently used by customers, the team may decide to put emphasis on it during product-training in order to increase adoption. Conversely, it may actually make more sense to package it as an “advanced” use case and keep the main onboarding path focused on the common features customers are having success with. The answer obviously depends on product nature and customer-success philosophy, but require clear data in order to formulate, measure and iterate on.
Similarly, product usage analytics is useful for the product-management team, as it helps them identify which parts of the product are working well and which require investment (or divestment). To make the data actionable, the ability to segment it to cohorts to get a clear understanding of which customers are using what is critical.
Report details
The details of usage analysis are very specific to organization, but all follow a similar process:
- Create account segments for every product behavior you want to review
- Create a report to combine all together to view trends
- Add breakdowns to the report to segment the customer base into relevant cohort
Scenario: Three months ago we released a new major version of our web-application, with a stated goal of driving adoption to 80%+ across the entire customer base.
- We’d like to understand where we are at in terms of adoptions of the new version (vs. customers that are still using the previous one).
- We would like to segment results based on different customer tiers (Basic, Premium & Enterprise) to see if adoption has been better in one segment vs. another and identify where we need to focus our energy to drive further adoption
- We’d also like to track the performance of the two version across sign-up cohorts, so we can see if momentum is picking up on new customers vs. older ones
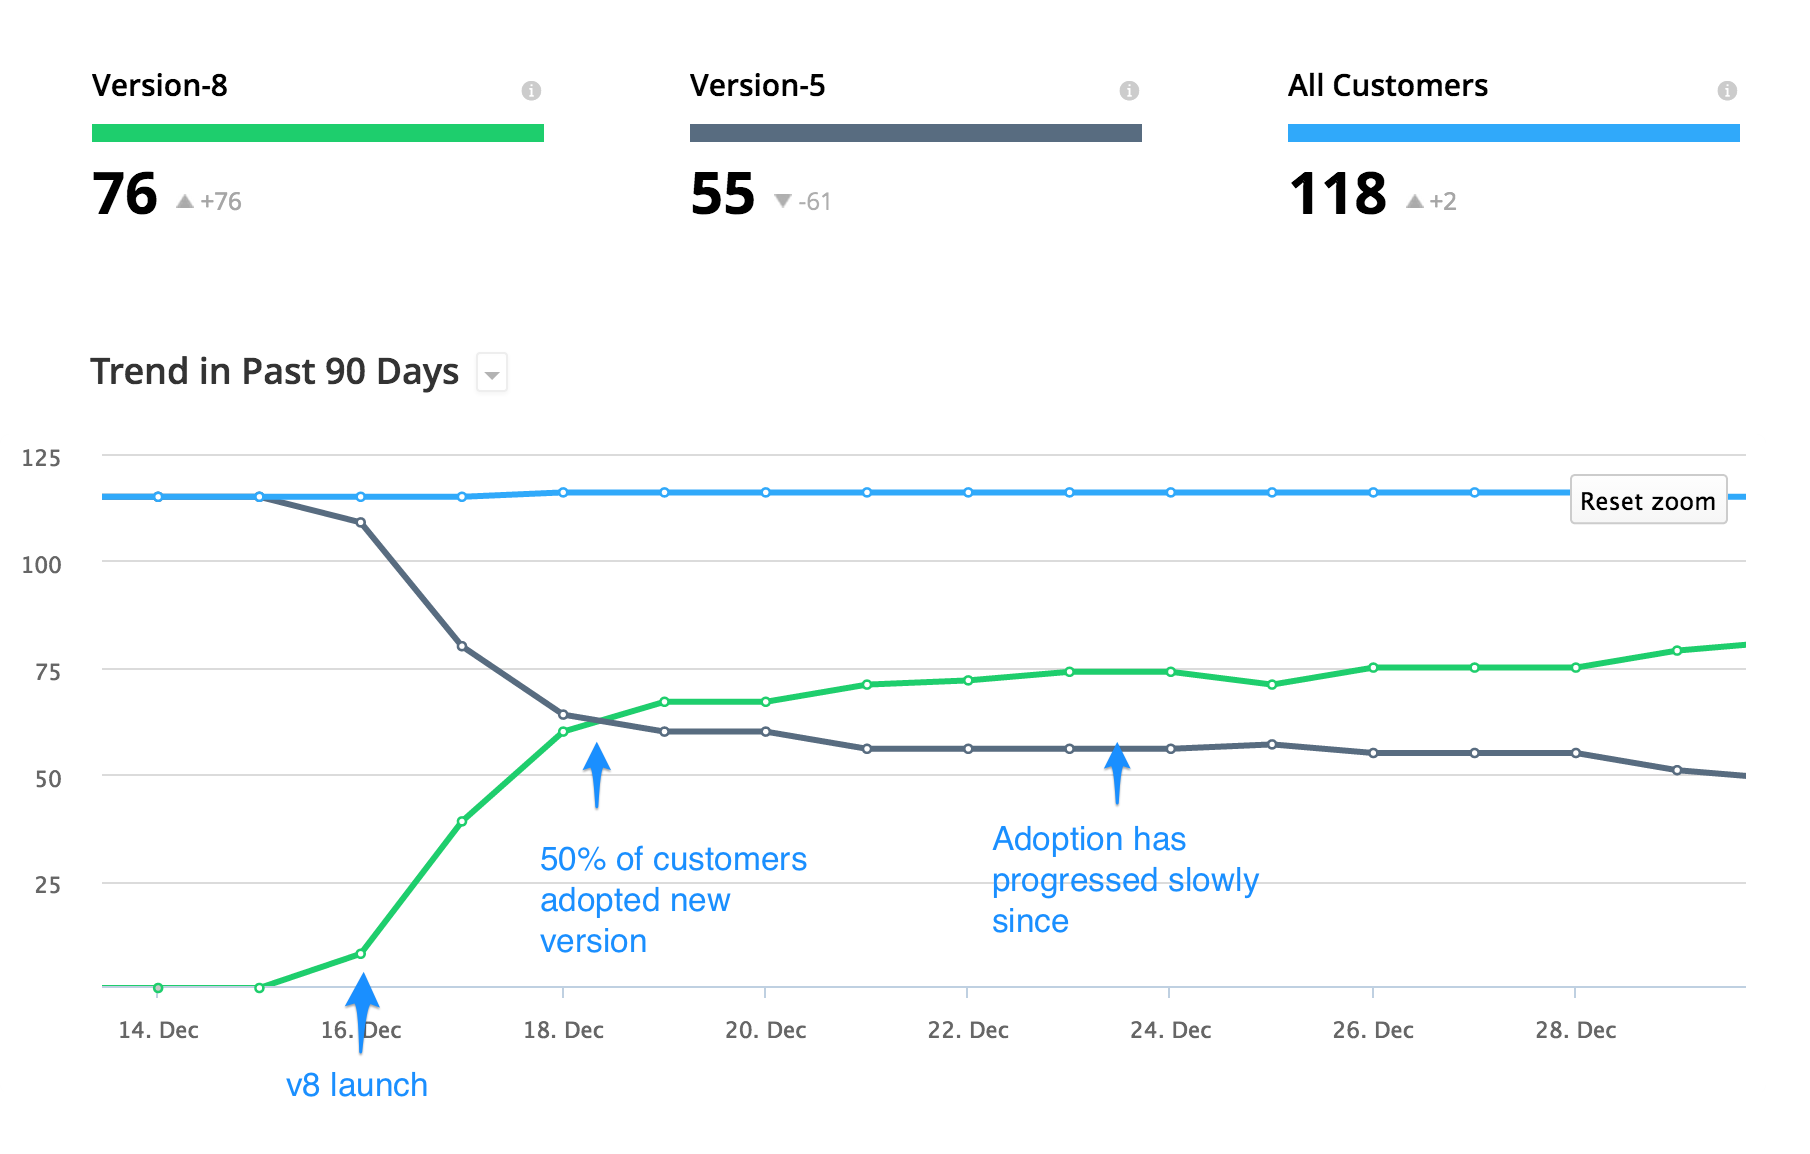
Start by creating a segment to represent each group you would like to report on. Then create a report to track adoption across the account base. In the example below, we also added a segment for “All customers” to help visualize the target goal (100% adoption of the new version)
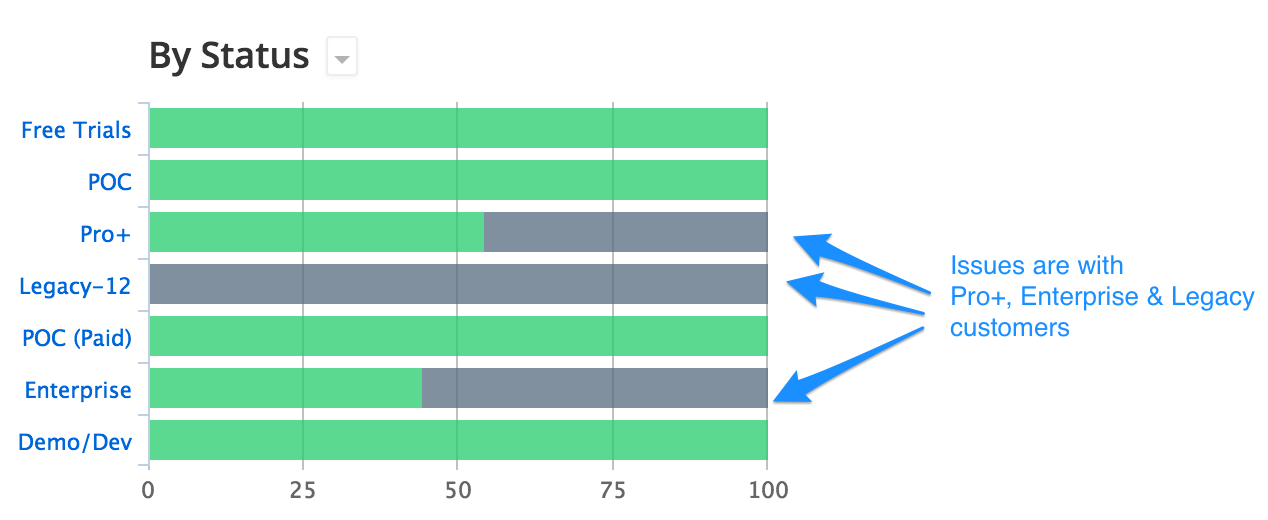
Add breakdowns based on any attribute. For example, by adding the Status attribute as a breakdown you can identify which customer-types are laggards in adoption:
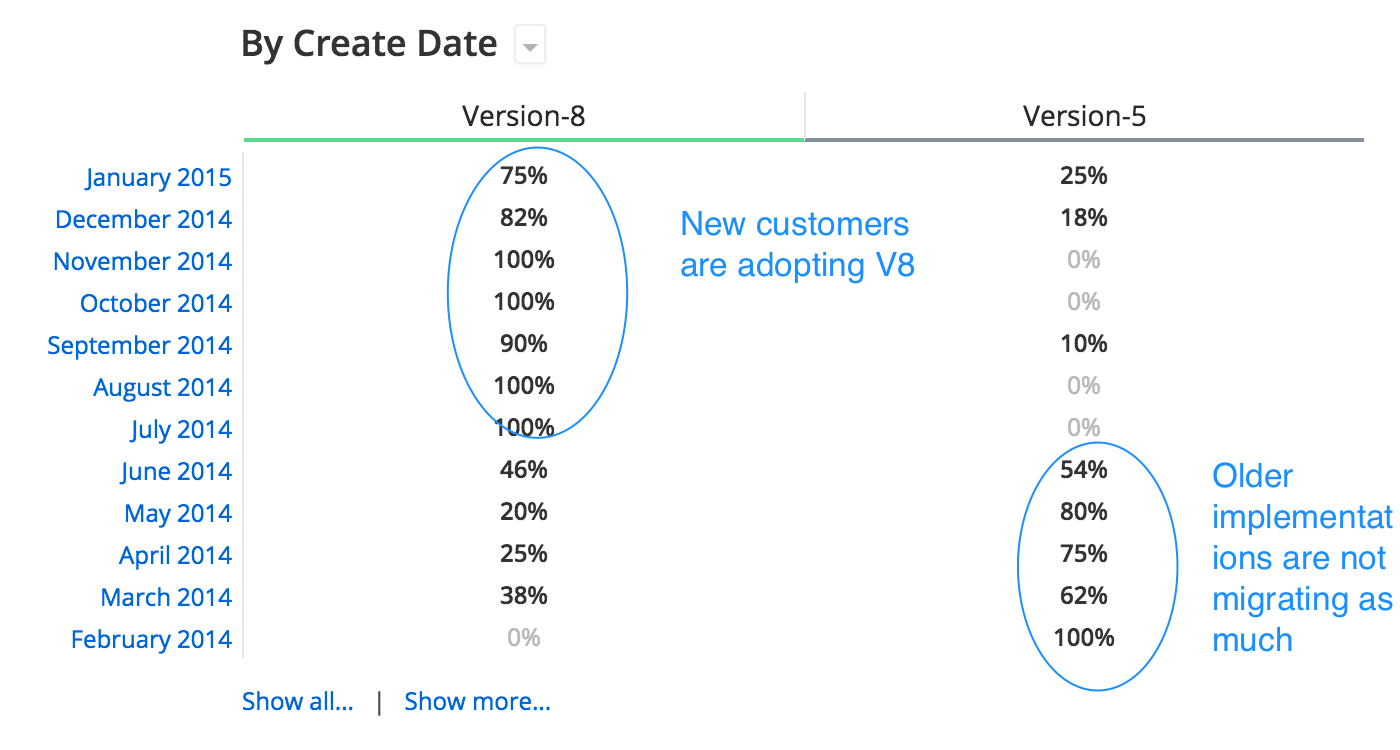
Another common view into data is looking at customer signup date (the Create Date attribute on Totango) to perform basic cohort analysis. This help shine a light on behavior differences between newer classes of customers vs older ones.